Long reads on the Hormuz crisis
How a 33-kilometre channel came to hold the global economy hostage — the timeline, the economics, the shadow fleet and the geography behind it all.
 Featured · Timeline
Timeline of the 2026 Strait of Hormuz Crisis
From the 28 February airstrikes that killed Iran's Supreme Leader to a fragile June ceasefire — the day-by-day account of how the world's busiest oil artery seized up.
 Economy
The Largest Energy Shock Since the 1970s
Brent past $126, emergency reserves unlocked and force majeure across the Gulf — the economics of a closed strait.
 Investigation
Dark Transits: The Shadow Fleet Keeping Oil Moving
Spoofed positions, dark voyages and 2.5 million barrels a day that still slip past a near-closed strait.
 Explainer
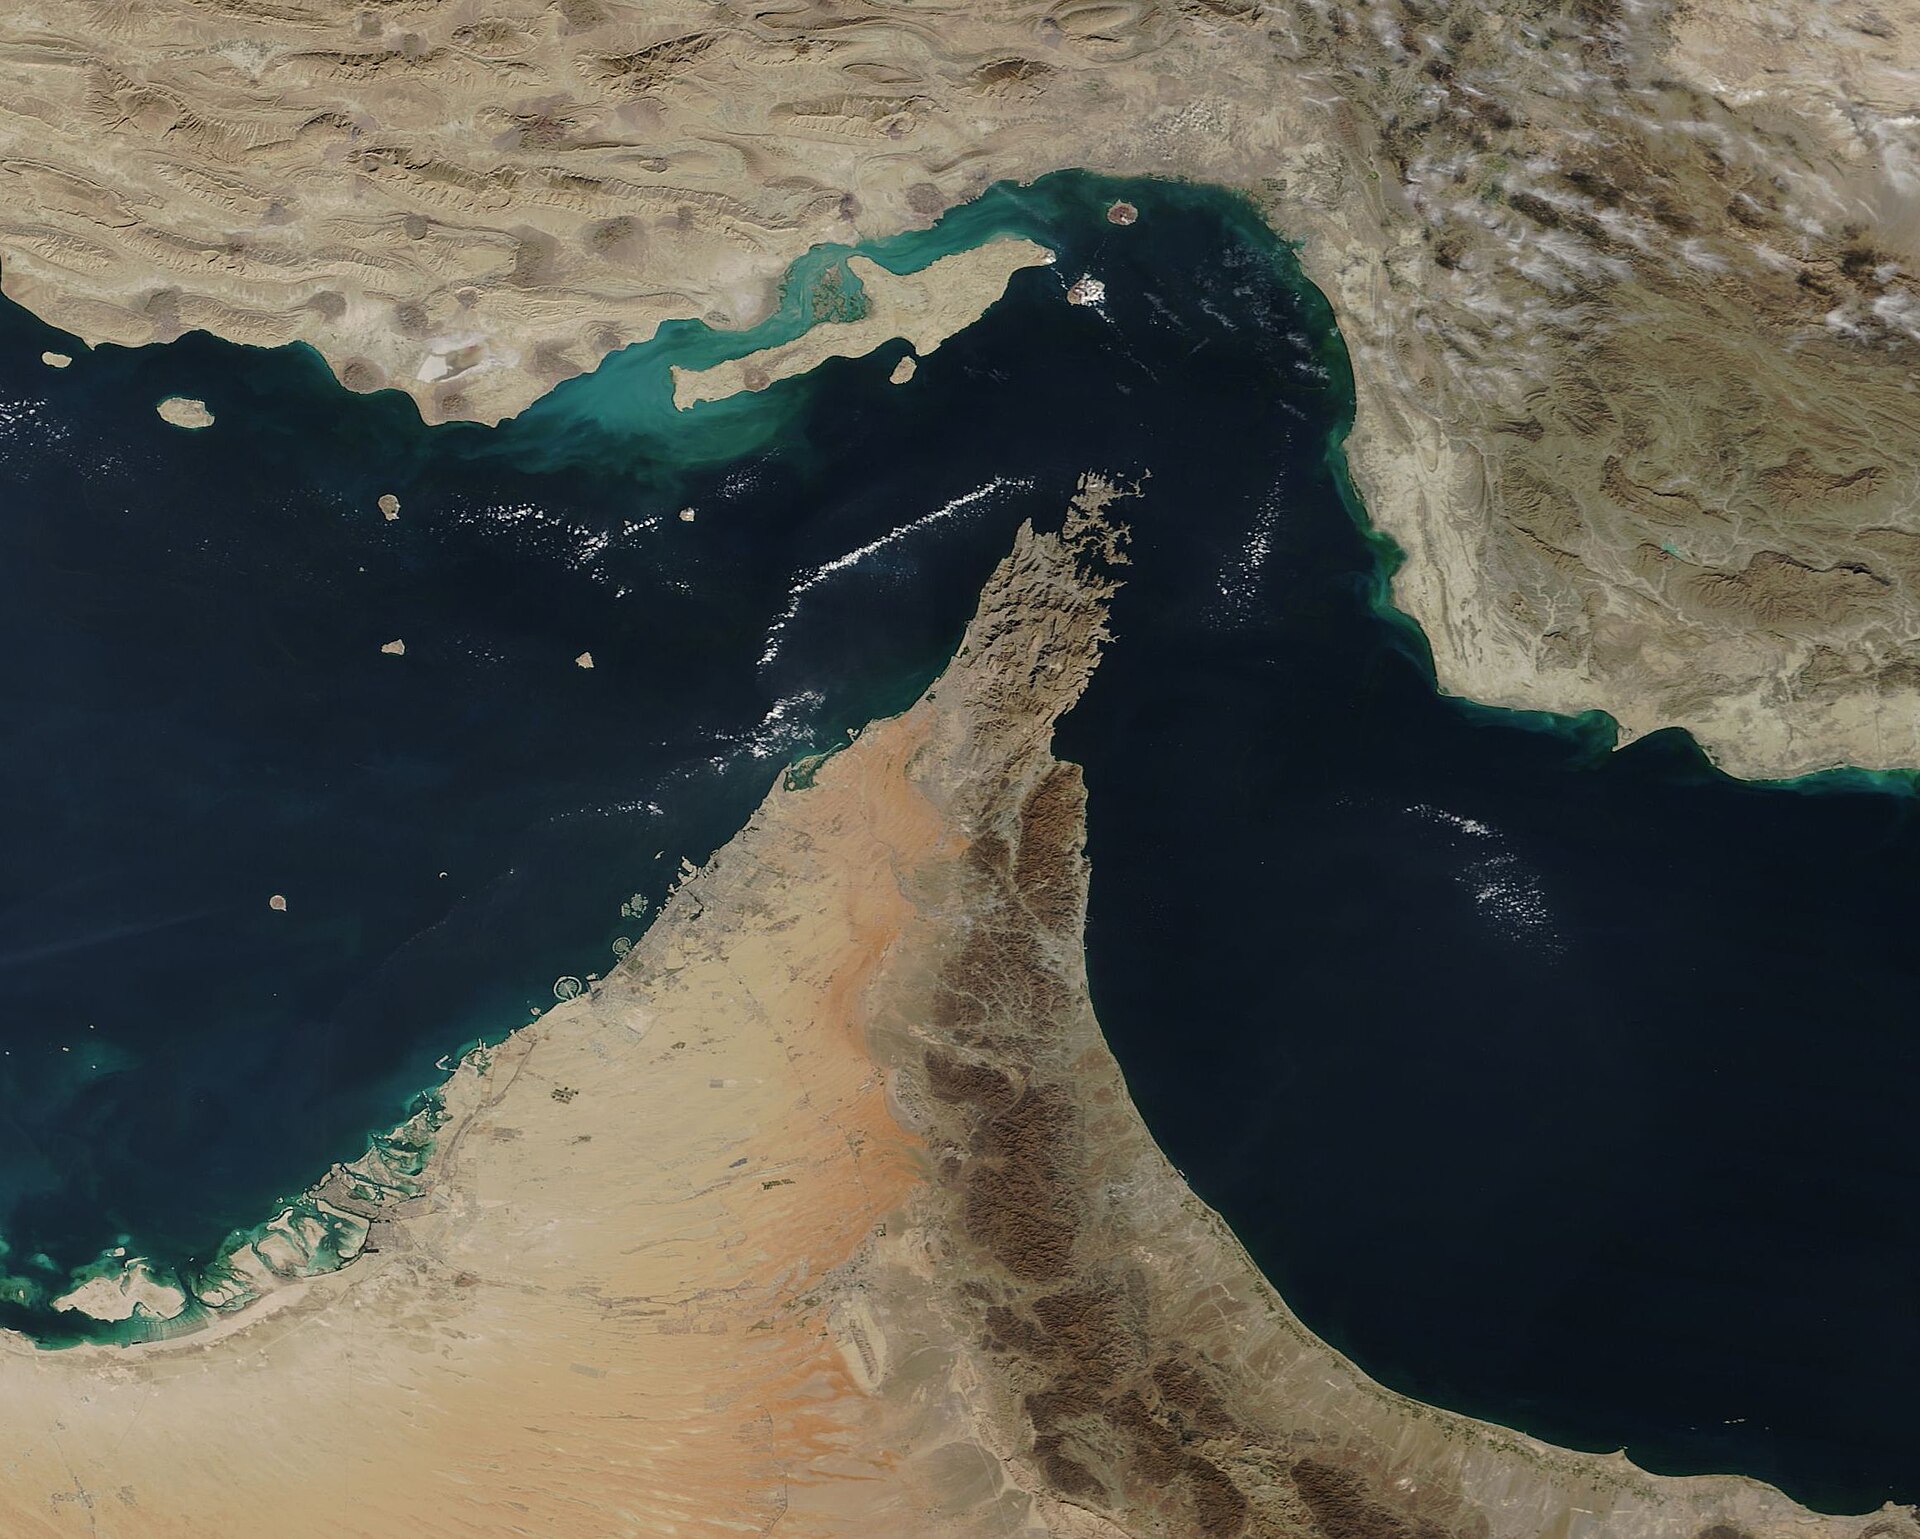
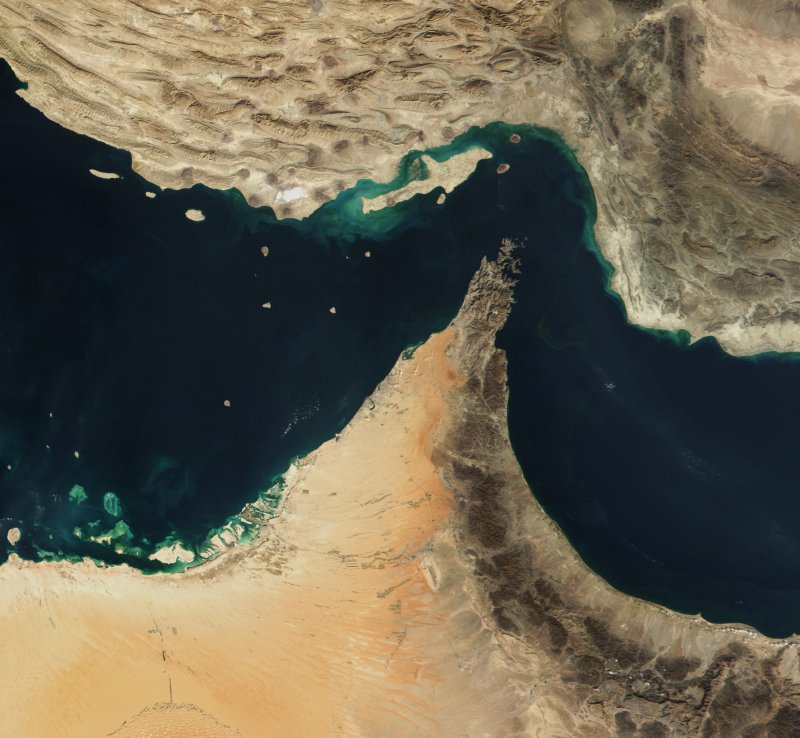
Why Hormuz Matters: Anatomy of a Chokepoint
Just 33 km wide, with shipping lanes barely 3 km across — the geography that makes Hormuz irreplaceable.
 Data
Data
The Blockade in Charts
Oil flows, Brent prices and bypass capacity — the crisis visualised, with the data behind every chart.